What Are Key Levels?
Learn what key levels are, why price reacts there, and how they help you study support, resistance, and market memory more clearly.
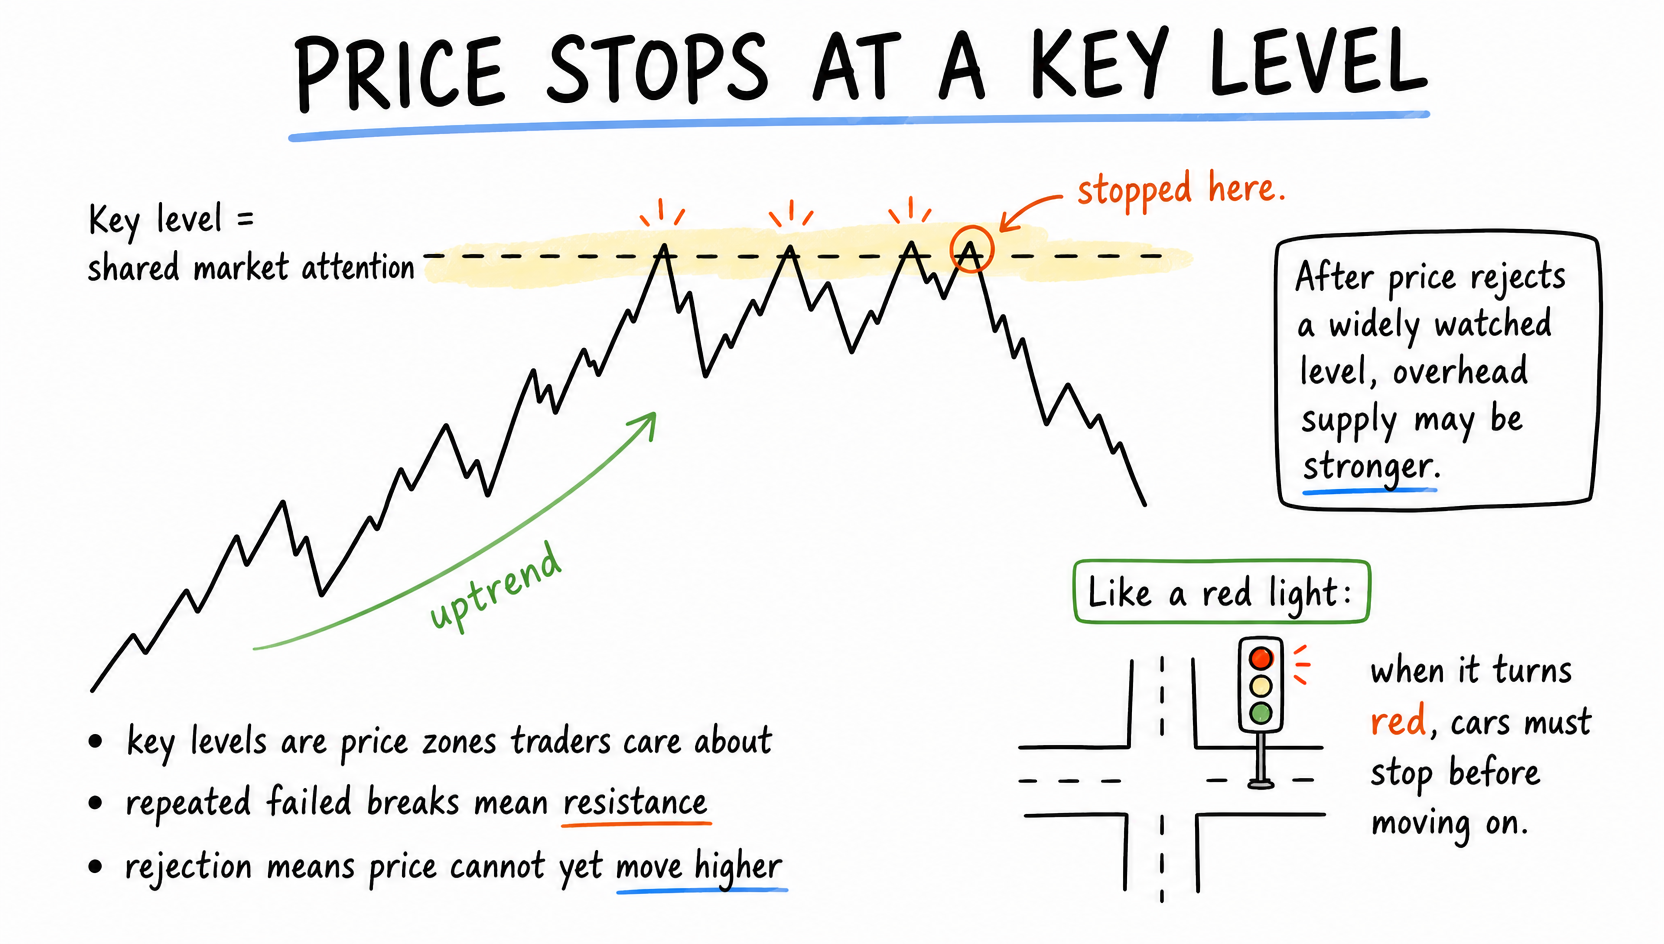
Key levels are the prices the market keeps remembering.
They matter because participants have history there: trapped positions, prior reversals, large volume, obvious highs and lows, and emotional decision points. The line you draw is only a marker for that shared memory.
Why price reacts there
Three forces often meet at key levels:
- clustered orders
- repeated attention from traders
- decisions from larger participants who need liquidity
That does not mean a level must hold. It means the level is worth watching.
What key levels are good for
Key levels help you answer better questions:
- where is the market likely to react?
- where is the current move being tested?
- where would a breakout need to prove itself?
They are observation zones, not automatic trade signals.
Common examples
- prior swing highs
- prior swing lows
- obvious range boundaries
- strong reaction areas from higher timeframes
- major round numbers
The mistake to avoid
Do not mark every minor pause. A useful level is usually one the chart would still care about if you zoomed out.
Continue with
Educational content only. Not financial advice.